Annual Arctic sea ice maximum second-lowest on record
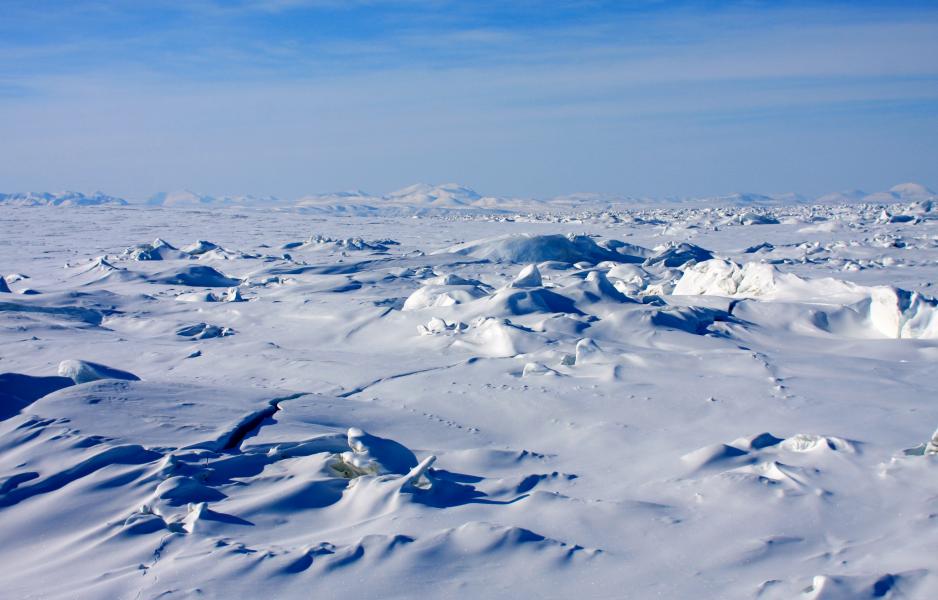
Arctic sea ice in the Canadian archipelago Source: Johannes Zielcke on Flickr.com (CC BY-NC-ND 2.0)
Arctic sea ice reached its annual maximum with 14.48 million square kilometers on March 17 the National Snow and Ice Data Center (NSIDC) reports. This represents the second-lowest extent since satellite observations began in 1979, just slightly behind last year’s record-low of 14.42 million square kilometers. It also caps a winter season marked by dramatic weather shifts and prolonged periods of unusually warm temperatures across the region.
Arctic sea ice reached its annual maximum with 14.48 million square kilometers on March 17 the National Snow and Ice Data Center (NSIDC) reports. This represents the second-lowest extent since satellite observations began in 1979, just slightly behind last year’s record-low of 14.42 million square kilometers. It also caps a winter season marked by dramatic weather shifts and prolonged periods of unusually warm temperatures across the region.
It is likely this winter would have set a new negative record, if it hadn’t have been for a brief period of cooler weather in mid-March leading to a late surge in ice growth and windy conditions that spread ice over a greater area making ice coverage appear larger, the NSIDC explains. The four lowest winter ice extent maxima have all occurred during the past four years indicating that Arctic sea ice is no longer able to recover during winter from record lows during the previous summer.
"We are in a new Arctic as most of the sea ice is now first-year – formed during the last summer – rather than multi-year ice that survived the previous summer’s melting," explains James Overland, Research Oceanographer for the National Oceanic And Atmospheric Administration (NOAA).
A dramatic winter season
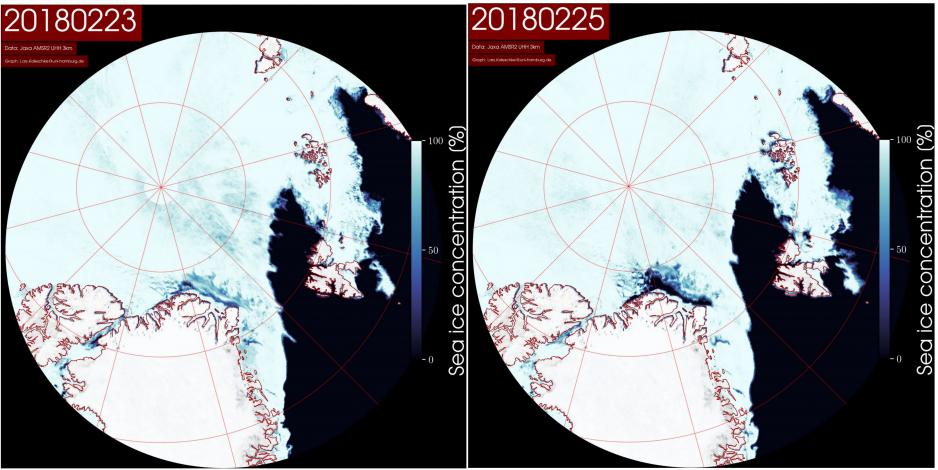
Ice extent was particularly low in the Bering Sea between Russia and Alaska, and in the Barents Sea off the northern coast of Norway and Russia. Both regions experienced above-normal temperatures for much of the winter resulting in reduced freeze-up and early melt. The Bering Sea especially saw an unseasonably early retreat of sea ice in February when the area lost as much as half of its ice coverage in just two weeks.

James Overland, Research Oceanographer for the National Oceanic And
Atmospheric Administration (NOAA). (Credit: NOAA)

Lars Kaleschke Professor for sea ice remote sensing at the University of Hamburg. (Credit: University Hamburg)
Ice chart showing the loss of around 50 percent of ice in the Bering Sea in a two-week period from February 6-20.
Source: Spreen, G., L. Kaleschke, and G.Heygster (2008), Sea ice remote sensing using AMSR-E 89 GHz channels J. Geophys. Res.,vol. 113, C02S03, doi:10.1029/2005JC003384.
The central Arctic over the North Pole witnessed an extreme heat wave with temperatures as much as 20 degrees Celsius above normal and above-freezing temperatures near the North Pole for an unprecedented consecutive 61 hours, more than tripling the previous record of 16 hours. This was the fourth year in a row that the Arctic experienced unprecedented heat waves in the midst of the winter season.
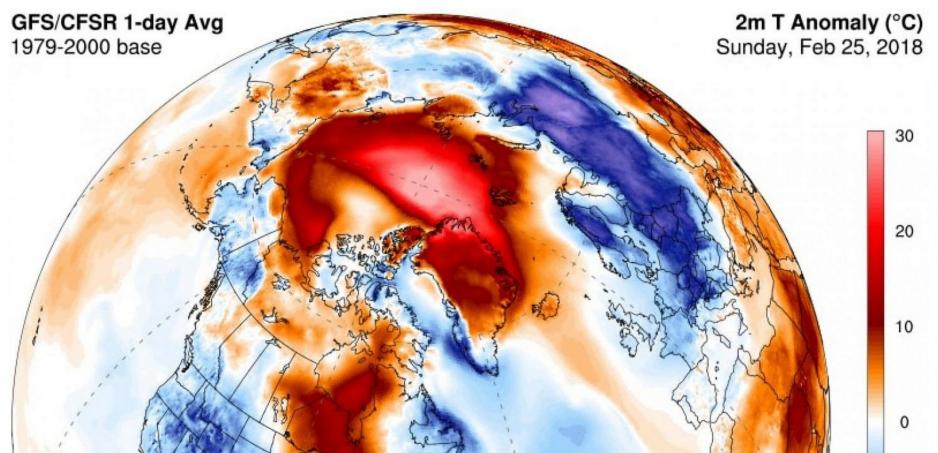
Anomaly chart showing temperatures as much as 20 degrees Celsius above average across much of the central Arctic in late February
Source: Climate Reanalyzer (http://cci-reanalyzer.org), Climate Change Institute, University of Maine, USA
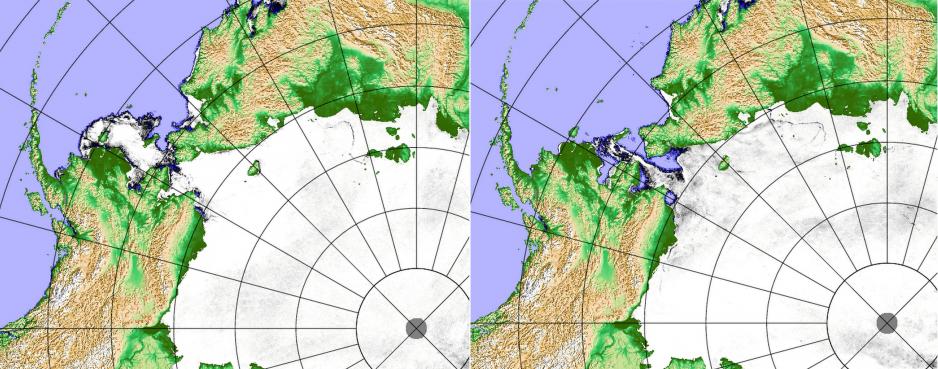
The area along northeastern Greenland experienced a highly unusual melt event in February where land-fast ice, ice that is connected to the shore or the sea floor, detached and dispersed opening hundreds of square kilometers of open ocean.
"This large open water area is very unusual. I haven't seen a similar event like this before in the almost 25 years I now work with satellite data," says Lars Kaleschke Professor for sea ice remote sensing at the University of Hamburg.
Ice charts showing the rapid breaking apart of land-fast ice at the northern tip of Greenland resulting in hundreds of square kilometers of open water.
Source: With permission by Lars Kaleschke/@seaice_de on Twitter.com
Ice no longer recovers during winter
In contrast to the summer months, sea ice decline has been more limited during the winter. In relation to the historical 1981-2010 average of 15.64 million square kilometers, ice has only declined around 10 percent. This compares to a decline of around 30 percent during the summer months. This situation however appears to be changing.
What the last four years indicate is that the ice has a harder and harder time bouncing back during winter. While ice was able to recover at least somewhat from record lows of the summers of 2007 and 2012 during the following winter, this is less and less the case. "In the old days summer minimums recovered quickly as in 2007 and 2012. But not anymore, the last three years had low record winter minimums," confirms Overland.
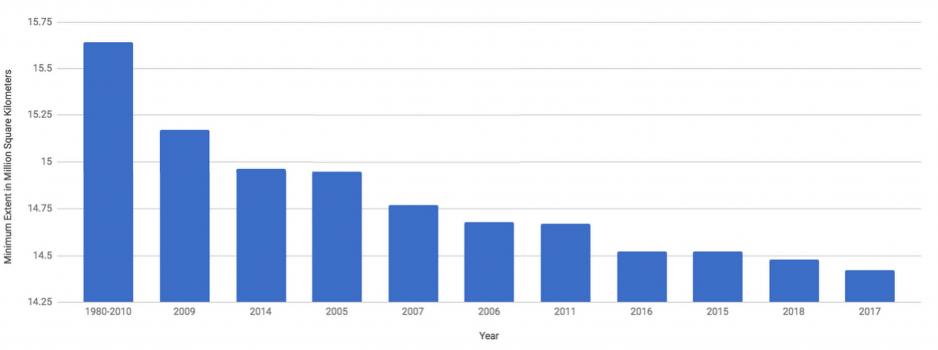
Ten years with lowest maximum Arctic Sea Ice Extent and the 1980-2010 Average.
Source: Author’s own work with data from NSIDC
Ice volume continues downward trend
Even more alarming than the decline of ice extent is the diminishing thickness or volume of sea ice. Here the winter of 2018 continues the downward trend in which 38 percent of winter ice volume has been lost since 1979. Sea ice being thinner makes it more susceptible to weather extremes, such as high winds, warmer air and ocean temperatures, and prolonged periods of clear skies, which thicker ice back in the 1980s and 1990s would have been able to withstand.
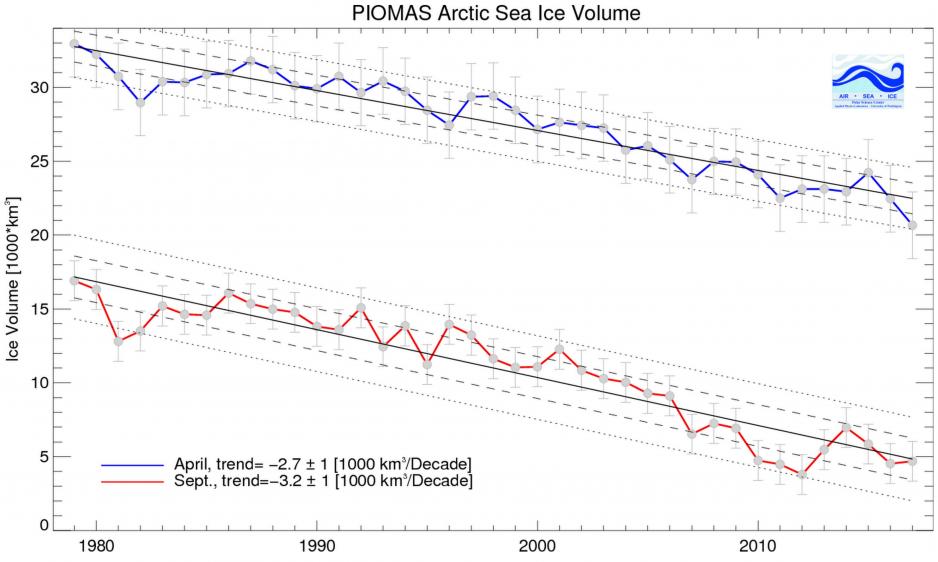
Annual maximum and minimum Arctic sea ice volume 1979-2017
Source: Schweiger, A., R. Lindsay, J. Zhang, M. Steele, H. Stern, Uncertainty in modeled arctic sea ice volume, J. Geophys. Res., doi:10.1029/2011JC007084, 2011
As temperatures across the Arctic increase about twice as fast as around the rest of the world, researchers continue to look for a connection between diminishing Arctic sea ice and extreme weather patterns in the mid-latitudes of Europe and North America, such recent cold spells across both continents. More and more research now suggests that Arctic warming does indeed affect the jet stream pattern and alters climate patterns thousands of miles outside of the region.