Scientists Assemble High-Resolution Dataset of 149 Glaciers in Svalbard Using AI
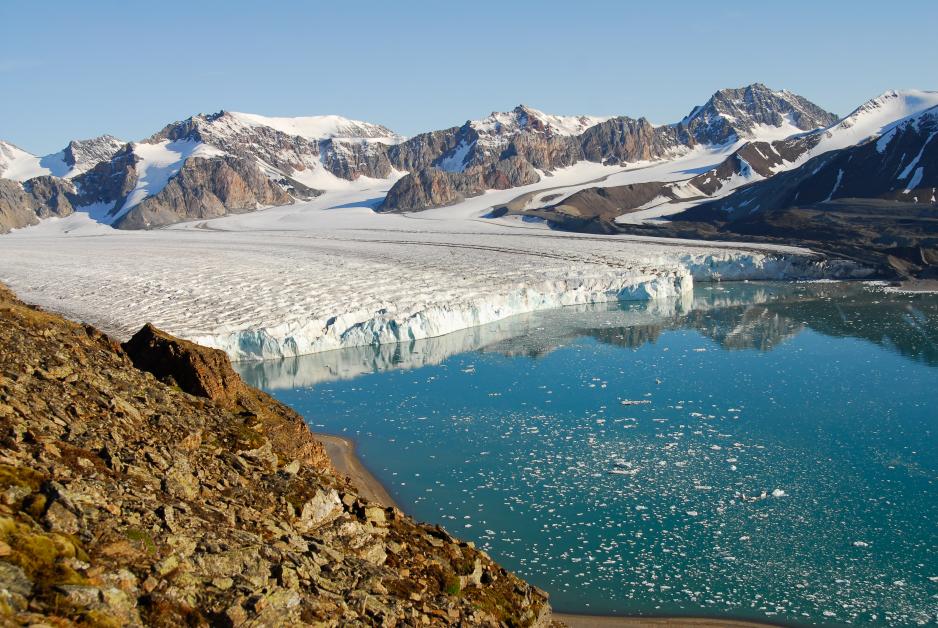
A marine-terminating glacier in Krossfjorden on Svalbard. (Source: GRID Arendal under CC BY-NC-SA 2.0 DEED)
Scientists used artificial intelligence to analyze 125,000 satellite images of glaciers in Svalbard to learn more about the seasonal melt patterns and ice mass loss of marine-terminating glaciers. Their work will help predict glacier dynamics and their contribution to future sea-level rise as other regions experience increased warming.
A new study analyzing the retreat of glaciers on Norway’s Svalbard archipelago aims to improve the understanding of the mechanisms behind the shrinking of glaciers. The mass loss of glaciers is a significant contributor to global sea level rise.
Svalbard offered the scientist an ideal site to study the impact the warming climate has on glaciers as the archipelago is experiencing amplified impacts of climate change.
The retreat of glaciers has been significantly accelerated in Svalbard as for the past 30 years the archipelago has experienced warming seven times the global average, or around 1.7 degrees Celsius per 10 years.
Widespread retreat
The study published in the Journal of Earth System Science used deep learning technology to assemble a catalog of satellite images of nearly 125,000 glacier positions between 1985 and 2023.
The scientists identified widespread retreat among the 149 glaciers analyzed, except for a handful of glaciers on Nordaustlandet.
The scientists were able to describe a complex pattern of glacier behavior as part of the seasonal calving patterns, which will help improve estimates of how much mass marine-terminating glaciers are losing as a result of climate change.
This type of ice loss has thus far not been included in most glacier models
Glaciers lose ice mass in several ways as they thin and retreat. This study was aimed at better understanding “frontal ablation,” which describes the loss of ice at the front of the glacier as a result of melting and calving – where massive chunks break off in singular events.
This type of ice loss has thus far not been included in most glacier models. The lack of data is especially prevalent for glaciers terminating in oceans due to the difficulty of routinely observing the calving events.
Blind spot
Across the Northern Hemisphere around 60 percent of glacierized areas fall into this category. Despite this prevalence of marine-terminating glaciers, only two studies have thus far analyzed their frontal ablation, in part due to the scarcity of observations.
This has created a blind spot when it comes to estimating mass loss of glaciers.
The study introduces a novel automated process using deep learning and neural networks to map the calving of glaciers. This new method, titled Charting Outlines by Recurrent Adaptation (COBRA), outperforms previous image segmentation models.
The new technology proved effective in accurately identifying and delineating the front of the glacier across the 125,000 image dataset.
The scientists relied on raw data from three different visual satellite platforms, Landsat, Terra-ASTER, and Sentinel 2 and radar images from Sentinel 1.
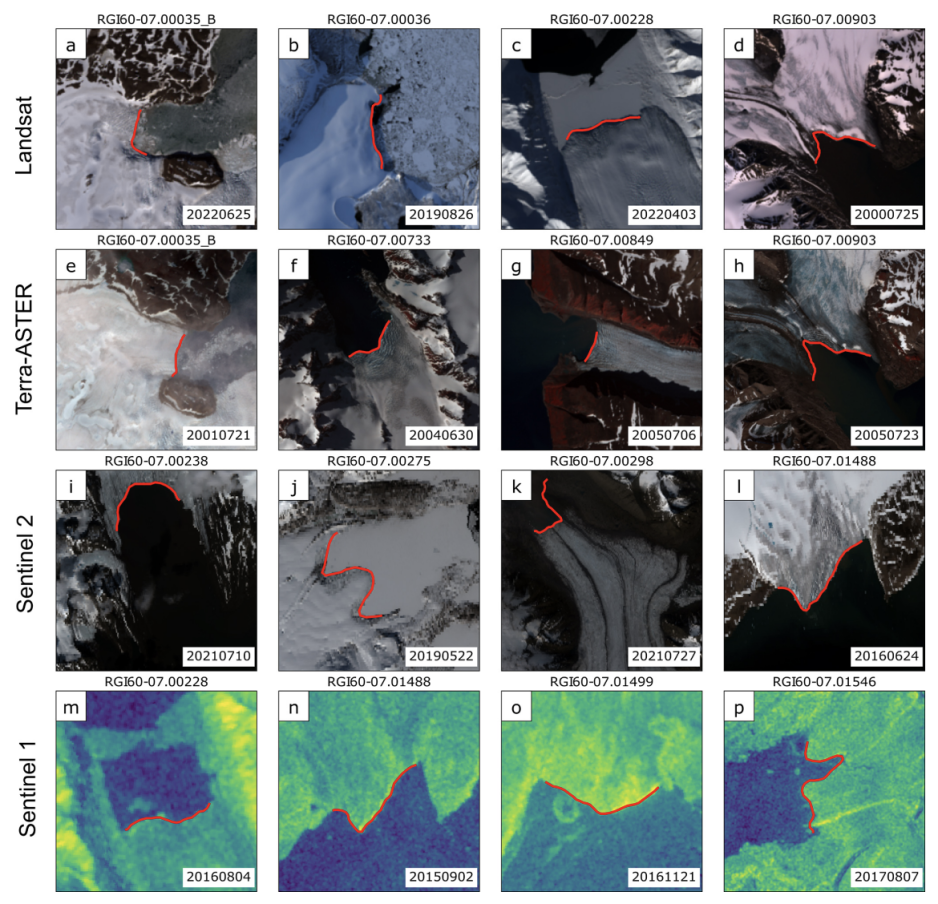
Examples of the post-processed glacier calving front traces for different satellite images from the four satellite platforms. The solid red lines are the final glacier terminus locations after post-processing. (Source: Tian Li et al.)
The researchers originally incorporated data from 220 glaciers, but the final study only comprises results for 149 glaciers; it excluded glaciers that retreated so rapidly that they became land-terminating during the 38-year period, and glaciers with too few data sets.
The study offers a granular look at the behavior of glaciers providing on average 100 glacier front locations per glacier per year, meaning the satellite images provide an “average temporal resolution” of just four days. The results have been visualized in a publicly accessible satellite map.
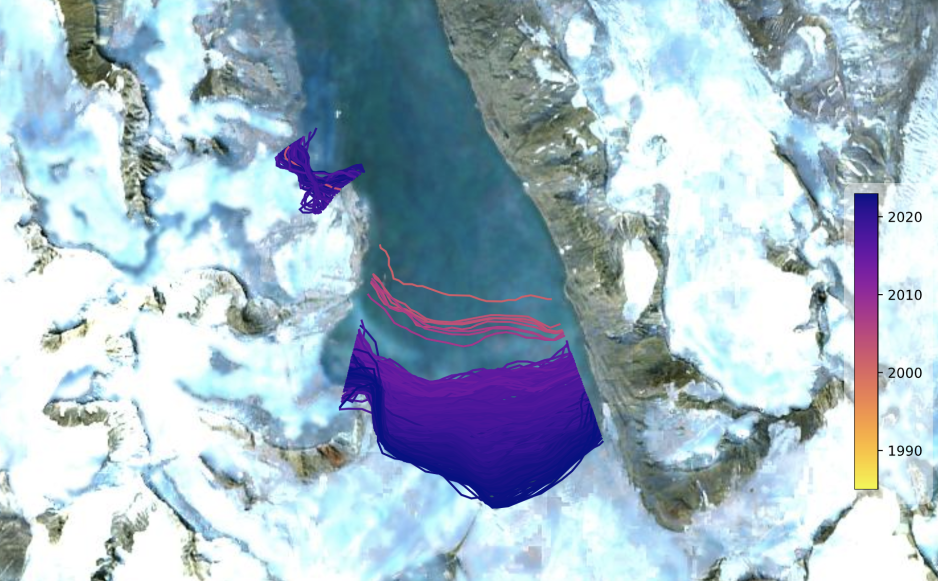
Screenshot of online satellite map viewer showing the front changes of Svalbard’s glaciers. (Source: https://maps.heidler.info/svalbard/)
Such a detailed look at the seasonal retreat and expansion of Svalbard’s glaciers allows for a better understanding of the yearly patterns of glacier front changes.
Out of the 149 marine-terminating glaciers part of the study 82.6 percent exhibited retreat during the study period, with the remaining number advancing or surging.
The dataset can now be used to better calculate the glacier mass balance – how much ice is being lost – and to better understand the calving mechanism.
It also helps to better predict glacier dynamics and their contribution to future sea-level rise as other regions with marine-terminating glaciers experience increased warming.


